
Anvil Open OnDemand Dashboard version 2 enters production
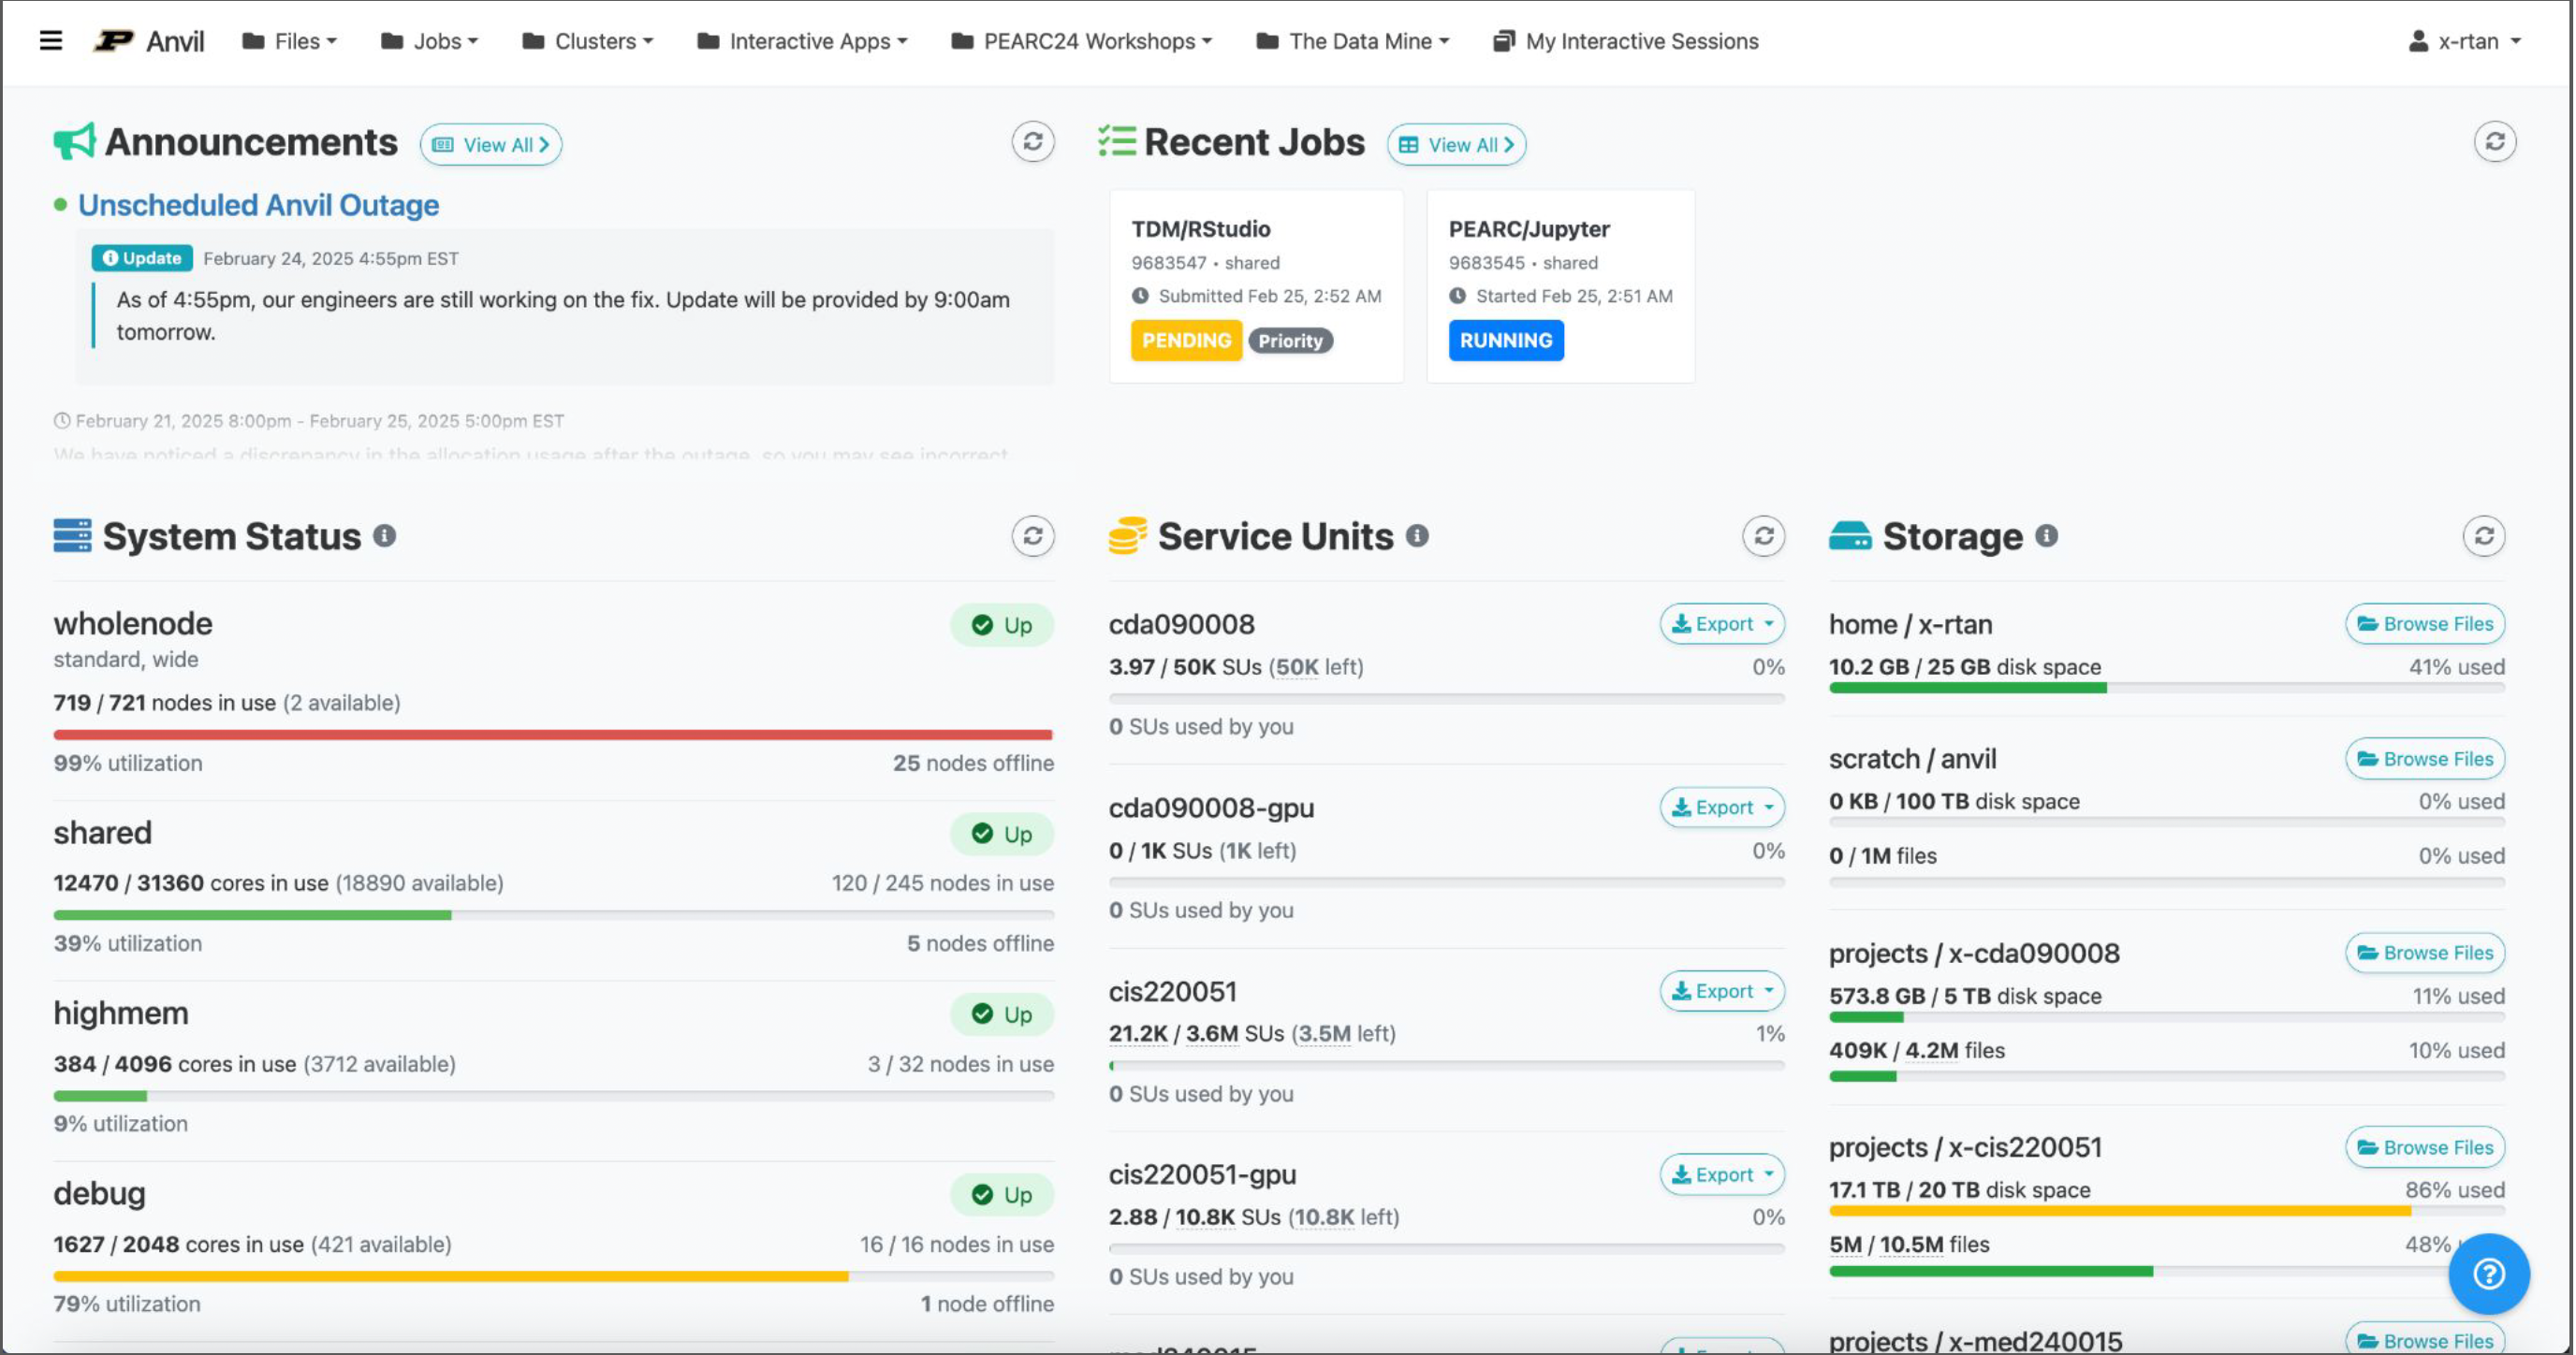
The Rosen Center for Advanced Computing (RCAC) has recently released the second version of their Anvil Open OnDemand (OOD) Dashboard. The Anvil OOD dashboard provides researchers who use the Anvil supercomputer with tools for user-friendly job accounting and performance metrics. Version 2 enhancements include the addition of Cluster Status, Job Overview, Cluster and Node Overview pages, as well as a Custom Timeframe selection option and a redesigned homepage.
The intent behind creating 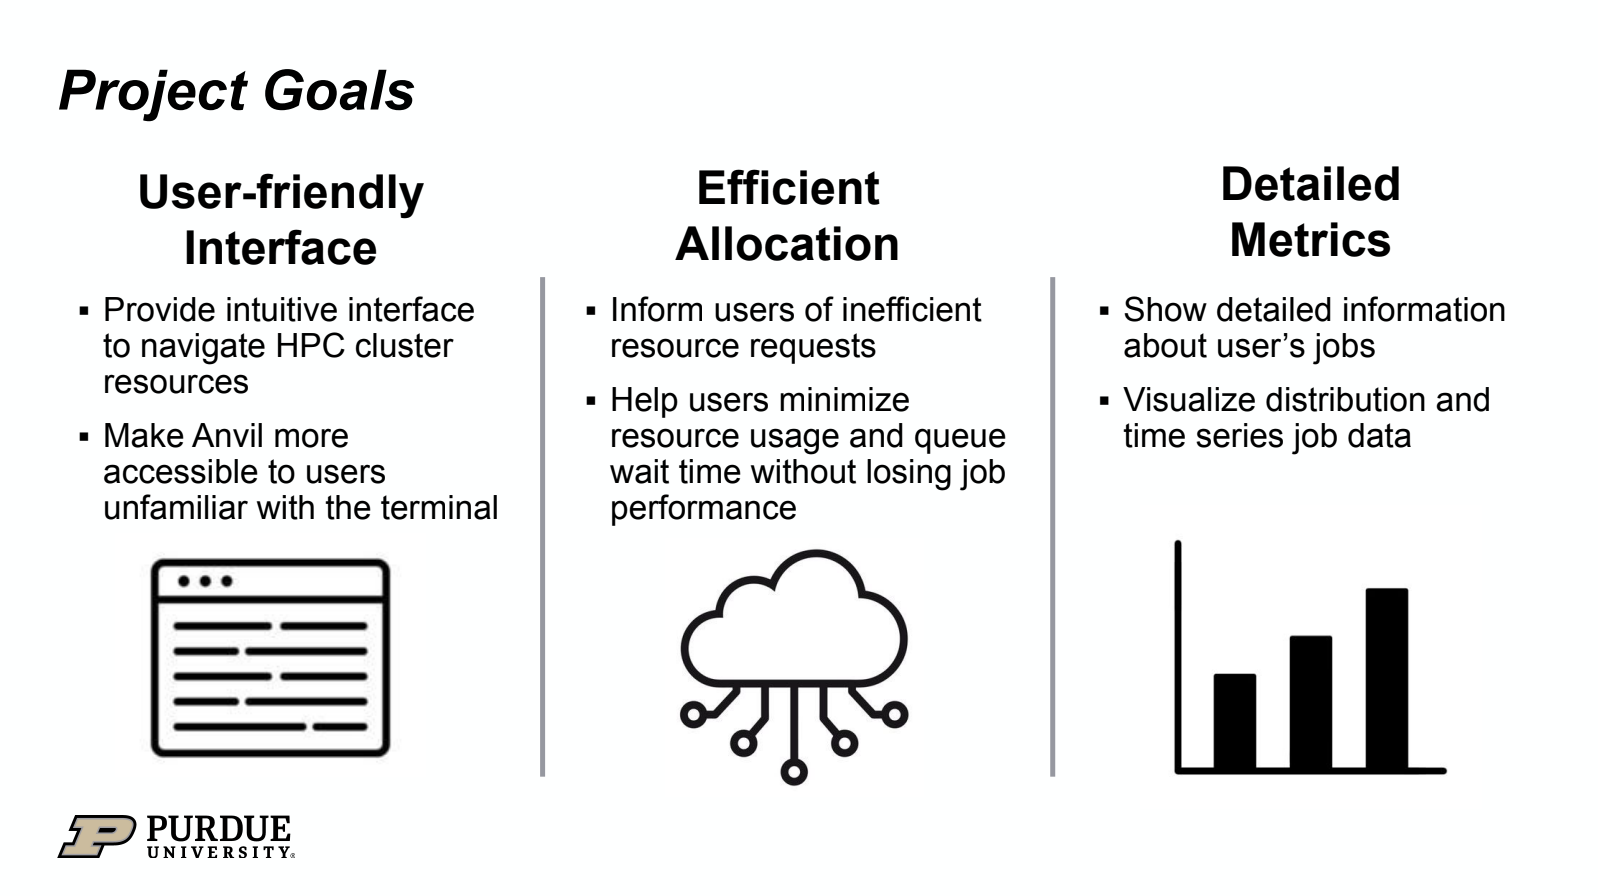 the Anvil dashboard was to provide Anvil users with an easy way to view metrics associated with their computational resources. These metrics—highlighting service unit usage, disk usage, queued jobs,etc.—help researchers understand how they are utilizing their computational resources and how they can improve their performance without any coding or command-line confusion. The development of the dashboard was part of the 2024 Anvil Research Experience for Undergraduates (REU) Summer program. Two students, Richie Tan and Anjali Rajesh, worked throughout the summer to build and implement the dashboard onto the Anvil system. Once the summer program ended, Tan was hired as a student employee to continue developing the dashboard.
Thanks to the work of the REU students, the Anvil OOD dashboard has been a huge success. The dashboard has a user-friendly interface for viewing users’ jobs and allocations, and makes it easy for those who do not have knowledge of the command line tools for inspecting this data. This is especially true of users who primarily utilize the interactive applications on Anvil’s OOD for their research and education. The new dashboard provides detailed metrics and incorporates advanced data visualization techniques to highlight job distribution. It also assists with promoting efficient computing, alerting users of inefficient job requests, and helping them minimize resource usage and queue wait time without losing job performance.
Version 1 of the Anvil dashboard went into production in January. It included features such as:
- Homepage widgets showing service units, disk usage, queued jobs, etc.
- My Jobs page for a comprehensive view of recent jobs on Anvil.
- Performance Metrics page for job performance summary over specific periods of time.
- In-memory caching for API requests.
While the first version of the dashboard was very useful, RCAC wanted to include more features and develop a sleeker design. He set out to completely redesign the user interface, included a host of new tools on the dashboard, and made optimizations in the backend, including cache optimizations. A full list of the new features available in the Anvil dashboard Version 2 include:
- New UI design: Brand new UI design to present a more modern look.
- Anvil AI Partition Status: Adding partition status check for the new Anvil AI partition.
- Cluster Status and Node Status: Allow users to have a glance of overall Anvil cluster status or dive deep into the status for specific compute node.
- New Announcement Widget: Now you can view past announcements with a scroll!
- New My Jobs page: Adding more features to My Jobs page.
- New Job page: View or control your specific jobs more easily through the job page.
- New Performance Metrics page: Now you can view your job performance metrics on Anvil within any time span.
Anvil OOD dashboard Version 2 is now live on the system and available for researchers to use. The dashboard has been incredibly useful to researchers so far and the RCAC is thrilled with its performance and reception. RCAC has plans to further improve the dashboard, and has already begun working on the next updates, which will include organizing node display by physical location (i.e., by rack) in the Cluster Status app, adding time series job data, upgrading to Open OnDemand v3.1 for use on other Purdue clusters, making it easier to port to other clusters, and, ultimately, contributing valuable features from the Anvil OOD dashboard to the main Open OnDemand project.
The Anvil OOD dashboard is made possible thanks to Open OnDemand. Open OnDemand was used as the base dashboard framework, which utilizes Ruby on Rails for the backend. Bootstrap 4 was used for styling, and Slurm Workload Manager for job accounting.
Anvil is one of Purdue University’s most powerful supercomputers, providing researchers from diverse backgrounds with advanced computing capabilities. Built through a $10 million system acquisition grant from the National Science Foundation (NSF), Anvil supports scientific discovery by providing resources through the NSF’s Advanced Cyberinfrastructure Coordination Ecosystem: Services & Support (ACCESS), a program that serves tens of thousands of researchers across the United States. Researchers may request access to Anvil via the ACCESS allocations process. More information about Anvil is available on Purdue’s Anvil website. Anyone with questions should contact anvil@purdue.edu. Anvil is funded under NSF award No. 2005632.
Written by: Jonathan Poole, poole43@purdue.edu