
Link to section 'Intel Vtune Profiler CLI Usage Guide' of 'Intel Vtune' Intel Vtune Profiler CLI Usage Guide
Intel VTune Profiler is a performance profiling tool for analyzing CPU, GPU, threading, and memory usage. This guide outlines how to use the VTune on RCAC clusters.
Link to section 'Loading on RCAC Clusters' of 'Intel Vtune' Loading on RCAC Clusters
Intel VTune is installed on the gilbreth cluster as a module and can be loaded with the following commands:
ml intel-oneapi-compilers/2024.2.1
ml intel-oneapi-vtune/2024.2.1
You can verify the location and version of vtune with the following:
which vtune
vtune --version
Link to section 'Collecting Performance Data' of 'Intel Vtune' Collecting Performance Data
Like other profiling software. VTune functionson two primary steps, Collection and Analsyis. Although collection is possible through the GUI, it is often easier to collect profiling data directly on the command line, and to then open results in the VTune graphical interface.
To collect results on an application your_app, you would generally follow the following structure:
vtune -collect [collection_type] -result-dir ./vtune_results ./your_app [args]
This will run a specific type of collection on your code, and store the results in a directory vtune_results. There are many different types of data collection that may be ran, each collecting different data, at varying levels of resolution. Common collection tpes are:
hotspots: Time-consuming code sections.- This is useful for collecting high level information on which functions or sections of code are taking the longest in execution, and can identify bottlenecks.
gpu-hotspots: GPU-bound kernel hotspots.- This is useful for identifying which GPU kernels are consuming the most time, and whether GPU compute units are underutilized.
gpu-offload: GPU offload inefficiencies and host-to-device interactions.- This is useful for analyzing how effectively the CPU is offloading work to the GPU, including time spent in queues, memory transfers, and kernel launches.
threading: Thread usage overview.- This is useful for analyzing thread creation, synchronization, and parallel region utilization, helping to identify load imbalances or serialization bottlenecks.
system-overview: System-level overview- Not available to non-root users due to security reasons
- Would normally give a broad view of CPU, memory, I/O, GPU, and other system metrics (like thermal throttling) to detect macro-level system bottlenecks.
memory-access: Memory bandwidth and access patterns.- Not available on
Gilbreth - This would be useful for identifying memory latency and NUMA inefficiencies, and can distinguish compute-bound vs memory-bound behavior.
- Not available on
io: Provides information on IO operations.- Not available on
Gilbreth - This would be useful for analyzing file reads/writes, disk latency, and I/O wait time, especially in data-intensive programs.
- Not available on
performance-snapshot:- Not available on
Gilbreth - Would normally give a quick one-shot summary of system-level CPU, threading, GPU, and memory metrics, in a high-level overview.
- Not available on
Link to section 'Analyzing Performance Data' of 'Intel Vtune' Analyzing Performance Data
From the directory you specified during profiling, you are able to immediately create profiling summaries directly on the command line via the report option in VTune:
vtune -report summary -result-dir ./vtune_results -format csv -report-output ./summary.tsv
VTune also offers a Graphical User Interface to analyze profiling runs directly, and can be launched with the vtune-gui command, which will lauch the GUI:
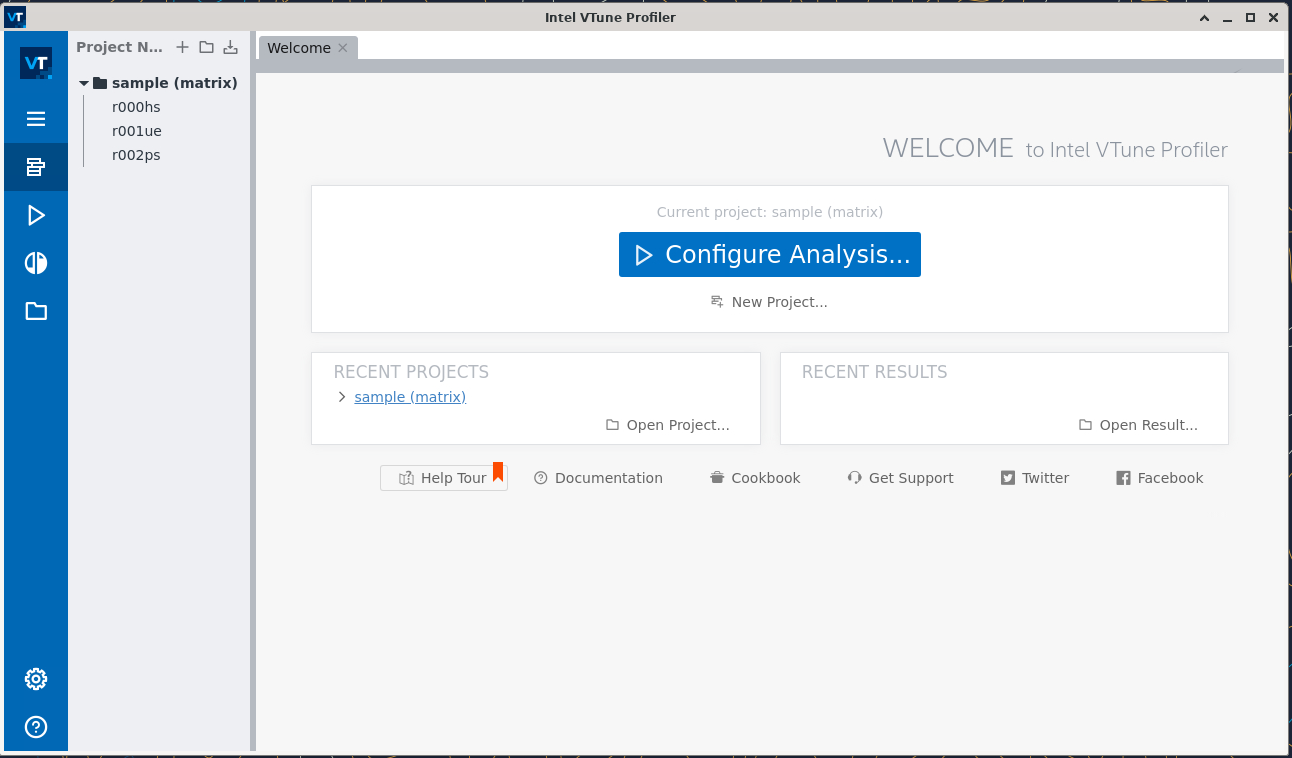
To load your existing results, you can use ctrl+o (or click on the hamburger menu on the left-hand toolbar > open > result folder) and navigate to /path/to/vtune_results/vtune_results.vtune.
Depeding on the profiling capture type, different visualizaiton and analysis options will be available. Using the tabs on the top of the window (when ersults are loaded) you will be able to navigate through the profiling resutls in varying levels of detail.
Link to section 'Example' of 'Intel Vtune' Example
In this simple program, we have introduced several inefficiencies that we may be able to detect through VTune profiling.
#include <iostream>
#include <vector>
#include <chrono>
#include <thread>
#include <cmath>

void inefficient_function() {
    std::vector<double> data(10000, 0.0);
    //Unnecessary nested loops
    for (int i = 0; i < 10000; ++i) {
        for (int j = 0; j < 10000; ++j) {
            //Redundant calculations (sin inside inner loop)
            data[i] += std::sin(j * 0.001);  // Expensive and repeated
        }
    }
}

int main() {
    auto start = std::chrono::high_resolution_clock::now();

    std::thread t1(inefficient_function);
    std::thread t2(inefficient_function);

    t1.join();
    t2.join();

    // Idle CPU time
    std::this_thread::sleep_for(std::chrono::seconds(2));

    auto end = std::chrono::high_resolution_clock::now();
    std::chrono::duration<double> diff = end - start;
    std::cout << "Program completed in " << diff.count() << " seconds.\n";

    return 0;
}
After we compile, we can collect poorly performing “hotspot” sections of this code with the following command:
vtune -collect hotspots -result-dir ./vtune_results./test
This saves results to a vtune_results directory, which can be directly analyzed with either the vtune -report option:
vtune -report summary -result-dir ./vtune_results -format csv -report-output ./summary.tsv
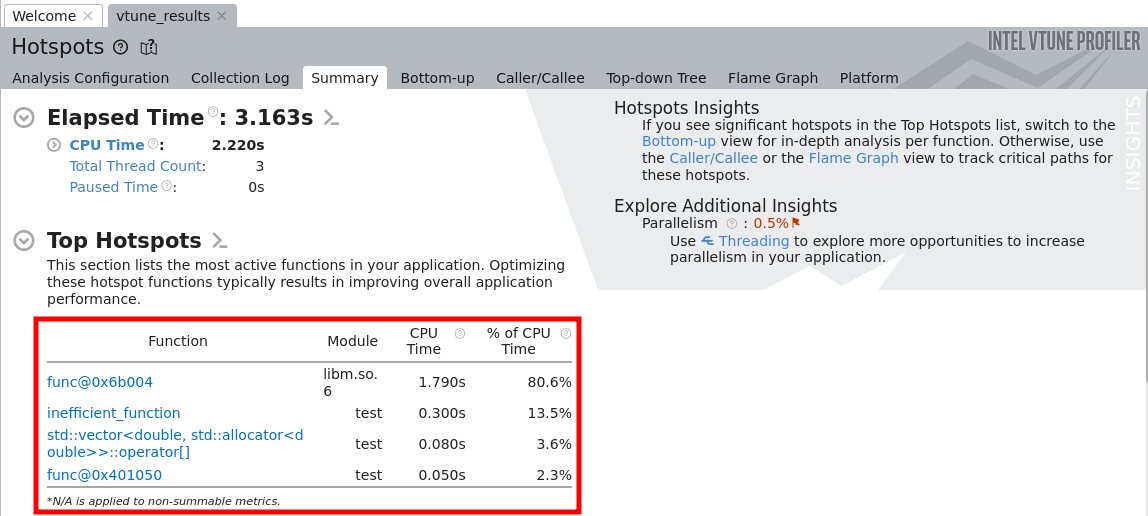
We can also visually analyze these results via the vtune-gui command, and opening the created vtune file with ctrl+o. This will open the summary page showing a general breakdown of wich sections and functions within the code were most time consuming:
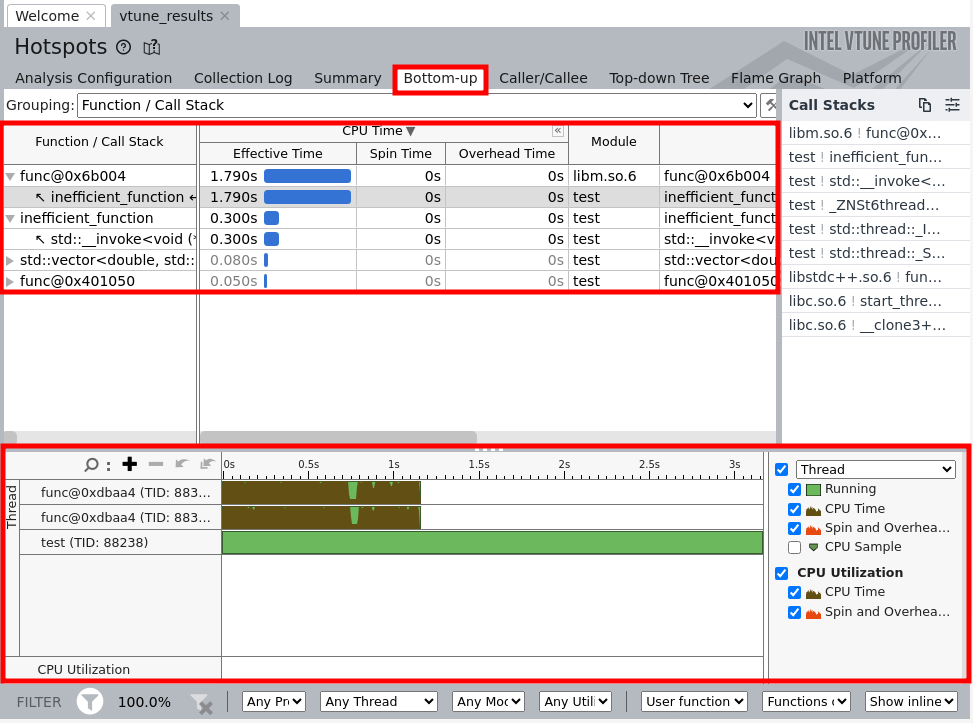
Further, by navigating to the “bottom-up” tab, you will be able to see a nreakdown of CPU and Overhead time for the duration of the profilnig run.
Link to section 'Limitations' of 'Intel Vtune' Limitations
- Several collection types (summarized above) are not available, either due to security restrictions to non-root users